You are using an out of date browser. It may not display this or other websites correctly.
You should upgrade or use an alternative browser.
You should upgrade or use an alternative browser.
Profit of Thuytien!
- Thread starter kity
- Ngày gửi


ATC
Thành Viên Có Cống Hiến GOLD24K.INFO
Gold
The bullishness stopped yesterday in areas around the psychological resistance of 1600.00 and then the metal reversed to the downside, which confirmed the continuous effect of the bearish symmetrical triangle pattern. The pattern`s first target is at 1552.00; however, the metal is facing 78.6% Fibonacci correction as shown above at 1579.00. In general, any trading below 1600.00 suggests the continuity of the downside movement . Stochastic is negative and supports our expectations.
The trading range for today is among the key support at 1530.00 and key resistance now at 1624.00.
The short-term trend is to the upside with steady weekly closing above 1475.00 targeting 1945.00.
Support: 1579.00, 1573.00, 1568.00, 1552.00, 1540.00
Resistance: 1590.00, 1594.00, 1600.00, 1608.00, 1624.00
Recommendation Based on the charts and explanations above our opinion is selling gold around 1590.00, targeting 1579.00, 1552.00 and 1530.00 and stop loss with 4-hour closing above 1624.00 might be appropriate.
Thuytien
<img src ="http://gold24k.info/diendan/images/vip-

Survey Participants Divided Over Views On Gold Market Direction Next Week
Friday May 11, 2012 12:03 PM
This week’s sharp sell-off and China’s weak data have survey participants in the Kitco News Gold Survey split on the direction for prices next week.
In the Kitco News Gold Survey, out of 33 participants, 24 responded this week. Of those 24 participants, nine see prices up, while seven see prices down, and eight are neutral. Market participants include bullion dealers, investment banks, futures traders, money managers and technical-chart analysts.
Those who see higher prices said gold is due for a rebound after this week’s sharp losses. Several called gold oversold, along with the broader market.
Those who see weaker prices said there’s little around to support prices at current levels and that momentum is lower. If the Greeks cannot form a coalition government, that will add to uncertainty and weigh on gold prices as the euro falls and the dollar rallies.
Ira Epstein, director of the Ira Epstein division of The Linn Group, said with no new headlines about Iran and given that gold hasn’t been able to rally on the sovereign-debt issues in Europe or politics there, something else happening. “In this case, it’s the (technical) chart action and choices investors are making. Investors are or have moved into bonds, notes, the dollar, yen and at times, stock indices. They are not driving gold or silver prices up…. Ultimately I think gold ends up sharply higher, but not now nor necessarily this summer. Therefore I think opportunity lies on the short side of the market.”
Survey participants who are neutral said they are being cautious and waiting on the sidelines to see how current events play out, regarding Europe’s political issues.
Thuytien
<img src ="http://gold24k.info/diendan/images/vip-
Giải trí cuối tuần
http://phim720p.com/movie/watch/80450/canh-sat-tai-ba.html
CẢNH SÁT TÀI BA
HONGKONG
:350::350::350::350:
http://phim720p.com/movie/watch/80450/canh-sat-tai-ba.html
CẢNH SÁT TÀI BA
HONGKONG
:350::350::350::350:
FUJI
New Member
http://www.youtube.com/results?sear...1.572.2977.3j1j3j2j2j1.12.0...0.0.M3kEyD02eXo
CẢNH SÁT TÀI BA
xem link này ổn định hơn nè tỉ
à, mà tỉ đi xa đâu xem được, hihi, post cho các mem xem vậy.
CẢNH SÁT TÀI BA
xem link này ổn định hơn nè tỉ
à, mà tỉ đi xa đâu xem được, hihi, post cho các mem xem vậy.
ATC
Thành Viên Có Cống Hiến GOLD24K.INFO
http://www.linkedin.com/news?viewAr...ack=.gmp_3429919.gde_3429919_member_112664902
CME to raise margins to meet new rules
CME to raise margins to meet new rules
ATC
Thành Viên Có Cống Hiến GOLD24K.INFO
EUR/USD Technical Analysis
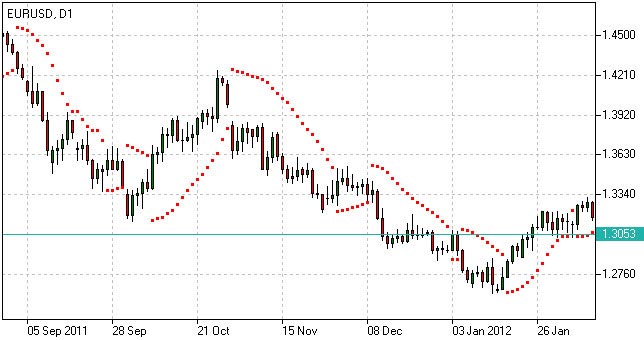
€/$ kicked off the week with a big weekend gap that sent it below uptrend support (discussed last week) and below 1.30. While it did recover above 1.30 for a short while, the gap was never closed.
The open gap was certainly a bearish sign. The pair continued lower and eventually traded between 1.29 and 1.2960, before closing at 1.2916.
Technical lines from top to bottom:
We start from a lower point this time. The round number of 1.34 was the top border of the wide 1.30 – 1.34 range. It capped the pair in the most recent surges. The next line below is round as well:, 1.33 was tough resistance 4-5 times, with two attempts before the downfall.
1.3212 held the pair from falling and switched to resistance later on. It proved itself as resistance once again in April 2012. This was the bottom border of tight range trading in February. 1.3180 capped attempts to rise in May 2012 and is a minor line on the way up.
1.3110 is another minor line that capped the pair in January and later in April 2012 as a stepping stone for a move higher. 1.3050 worked as support in April 2012 and also in March, and is next frontier above 1.30.
The round number of 1.30 is psychologically important and proved to be a place of struggle. After the downfall, the pair made another attempt to fight over this line, but this failed.
1.2960 is minor resistance after capping the pair following the downfall in May 2012. It is followed by 1.29 which provided support more than once after the fall.
Very close, 1.2873 is the previous 2011 low set in January, and it returns to support once again. This is a very strong line separating ranges. 1.2760 is a pivotal line in the middle of a range. It provided support early in the year.
1.2660 was a double bottom during January and the move below this line was not confirmed. 1.2623 is the current 2012 low, but only has a minor role now.
Below, 1.2587 and 1.25 await, but these lines weren’t seen since 2010.
Uptrend Support – Broken
The narrowing channel that characterized the pair for so long was very convincingly broken to the downside.
I remain bearish on EUR/USD
The results in Greece were worse than expected: no new government and a growing chance that a new government will take Greece out of the euro-zone. This might be good for Greece in the long run, but a serious pain for Europe, especially from the feared “domino effect”, including bank runs. A big domino, Spain, is having serious troubles of its own and took an unintended step towards receiving a bailout package. The downside potential is significant, especially as the US remains stable for now.
ATC
Thành Viên Có Cống Hiến GOLD24K.INFO
AUD/USD Technical Analysis
AUD/USD opened at 1.0454. The pair reached a high of of 1.0461, pushing past the resistance line of 1.0230 (discussed last week), as it reached a low of 1.0170. The pair closed the week down sharply, at 1.0174.
Technical levels from top to bottom:
With AUD/USD dropping sharply, we will adjust our support and resistance lines accordingly. We start with resistance at 1.0724. This line has held firm since early March. This is followed by strong resistance at 1.0650.
Next, there is resistance at 1.0525, which saw a lot of movement by the pair in March. Below, 1.0402, which was in a support role last week, was breached this week on the downswing by AUD/USD. It is now providing the pair with strong resistance.
Close by, 1.0340 was repeatedly tested in April, and is now in a resistance role. Next, the line of 1.0230, which had held firm in support since January, is now providing weak resistance. This line could see further action if the Australian dollar rebounds.
Below, the pair is supported at 1.0080, which is protecting the all-important parity level. This level has not been breached since December 2011, but is looking more vulnerable than earlier in the year. Below parity is the line of 0.9964, a strong support level dating back to December 2011. Next 0.9917 is providing strong support to the pair. The final line for now is 0.9860, which has held firm since last November.
I am bearish on AUD/USD.
Last week’s surprise interest rate cut hammered the Australian dollar. The deep cut in interest rates signals that the central bank is trying to revive the economy with monetary measures, and this could hurt the aussie in the short term. If key releases this week disappoint the markets, we could see AUD/USD continue to point downward.
ATC
Thành Viên Có Cống Hiến GOLD24K.INFO
GBP/USD Technical Analysis
GBP/USD opened the week at 1.6118. After reaching a high of 1.6199, the pound weakened, as the pair easily broke through the weak support level of 1.6142 (discussed last week). GBP/USD dropped to 1.6060, where it closed the week.
Technical levels from top to bottom
We start with resistance at 1.6474. After falling below this level last summer, GBP/USD went on a sharp spiral downwards, which lasted until October 2011.
Next, 1.6356, is providing the pair with strong resistance. This is followed by 1.6265, which has strengthened as GBP/USD trades at lower levels. The 1.6142 line is now in a resistance role, after providing the pair with support in recent weeks. This is followed by the psychologically important support level of 1.60, which looks to be tested if the dollar continues to rally. Next, 1.5930, which saw a lot of movement in April, has been providing strong support for the pair.
Below, there is support at 1.5805, which also was tested in April. The next support level is 1.5750, which has provided support since mid-March. The next support level is at 1.5648, which was last tested in March. The final line for now is 1.5603, which has held firm since January.
I am bearish on GBP/USD.
GBP/USD continues on a downward trend. Stronger US data coupled with the turmoil in Europe is sending investors to safe haven currencies such as the dollar, and the pound is paying the price. Unless there is some disappointing data out of the US this week, look for the pound may continue to lose ground to the dollar, as the pivotal line of 1.60 is now in sight.
ATC
Thành Viên Có Cống Hiến GOLD24K.INFO
Vào thứ bảy, hôm qua, Ngân hàng nhân dân Trung Quốc, ngân hàng trung ương, cho biết sẽ cắt giảm yêu cầu dự trữ của các ngân hàng 0,50 điểm phần trăm có hiệu lực từ ngày 18 tháng 5, theo một tuyên bố đăng trên trang web của mình.
:bk::bk::bk:
Vậy là hy vọng thứ hai Á sẽ gom vàng, hihi
:bk::bk::bk:
Vậy là hy vọng thứ hai Á sẽ gom vàng, hihi
FUJI
New Member
Chỉ báo Parabolic
Mục đích
Chỉ báo Parabolic được phát triển bởi Welles Wilder cho mục đích xác nhận hoặc bác bỏ các xu hướng, khởi đầu giai đoạn điều chỉnh, hoặc chuyển động lên, cũng như xác định khả năng của các điểm đóng vị trí. Nguyên tắc làm việc của chỉ báo nằm ở cơ bản có thể được mô tả giai đoạn "ngừng và đảo ngược".
Cách sử dụng
Khi sử dụng các chỉ báo cần xem xét như sự phân bố của biểu đồ giá, cũng như yếu tố tăng tốc, tăng với xu hướng phát triển. Mặc dù phổ biến của nó như một công cụ phân tích biểu đồ, chỉ báo có một số hạn chế và có thể cung cấp cho các tín hiệu sai lầm trong trường hợp, ví dụ, chuyển biến của thị trường thường xuyên thay đổi .
Chỉ báo cho các tín hiệu sau:
Việc xác nhận xu hướng
Nằm dưới biểu đồ giá, chỉ báo xác nhận xu hướng tăng;;
Nằm trên biểu đồ giá, chỉ số xác nhận xu hướng giảm;
Xác định các thời điểm đóng vị trí
Khi giảm giá dưới chỉ báo trong điều kiện xu hướng lên nên đóng các vị trí dài
Khi tăng giá cao hơn chỉ báo trong điều kiện xu hướng giảm nên đóng vị trí ngắn
Tầm quan trọng của tín hiệu được xác định bởi các yếu tố tăng tốc. Các yếu tố tăng mỗi khi giá đóng cửa hiện nay cao hơn trước đó trong trường hợp xu hướng tăng và thấp hơn so với trước đó trong trường hợp xu hướng giảm.Người ta tin rằng, chỉ báo đáng tin cậy hơn nếu giá và chỉ báo đường cong di chuyển song song, và ít đáng tin cậy khi chúng bắt đầu hội tụ.
Tính toán
P(t) = P(t-1) + AF x (EP(t-1) – P(t-1)),
где:
P(t) – giá trị hiện tại của chỉ báo;
P(t-1) – giá trị của chỉ báo trong giai đoạn trước;
AF – nhân tố tăng từ bước 0.02 trong khoảng [0.02;0.2];
EP(t-1) – giá trị thấp nhất/cao nhất của giá trong giai đoạn trước.
FUJI
New Member
Thăm dò tuần từ 14/5 đến 19/5: vàng xuống mức thấp có thể kích thích lực mua (06:58 - 14/05/2012)
Khảo sát ý kiến của các nhà phân tích thấy việc giá vàng giảm xuống mức thấp nhất trong 4 tháng có thể kích thích nhu cầu mua vàng.
Cuộc khảo sát của Kitco về giá vàng trong tuần này, 9/24 người dự báo giá tăng, 7 người dự báo giá giảm và 8 người đưa ra quan điểm trung lập. Tham gia vào các cuộc thăm dò này là các công ty kinh doanh vàng, ngân hàng đầu tư, nhà giao dịch kỳ hạn, nhà đầu tư và chuyên gia phân tích kỹ thuật.
Còn trong cuộc thăm dò của Bloomberg, 14 trong tổng số 32 nhà phân tích kỳ vọng giá đi lên, 6 giữ quan điểm trung lập, 12 người kỳ vọng giá giảm.
Việc vàng chốt phiên cuối tuần trước tiếp tục mất giá là do kim loại quý chịu áp lực từ các số liệu kinh tế không mấy lạc quan từ Trung Quốc, làm dấy lên lo ngại về tốc độ tăng trưởng kinh tế toàn cầu. Thêm vào đó, vàng còn chịu áp lực mạnh hơn khi “gã khổng lồ” J.P.Morgan cho biết gần đây ngân hàng này đã lỗ tới 2 tỷ USD. Điều này làm cho nhà đầu tư tìm đến đồng bạc xanh như một kênh đầu tư an toàn và khiến thị trường vàng càng lao dốc mạnh, dẫn đến việc một số nhà băng lớn như BNP Paribas và Barclays hạ triển vọng kim loại quý.
Lực bán vàng ngày càng lớn làm cho các nhà đầu tư càng thêm cẩn trọng trong các quyết định đưa ra.
Tuy hướng đi của kim loại quý trong tầm ngắn hạn không dễ xác định, về dài hạn, các nhà phân tích vẫn tin rằng vàng sẽ đi lên.
Theo đó, các nhà tham gia thị trường cho rằng việc vàng nằm dưới ngưỡng 1.600 USD/oz làm sức hấp dẫn kim loại quý đã bắt đầu quay trở lại, tuy chưa mạnh.
Các nhà phân tích Nomura thì cho biết đã có một số dấu hiệu cho thấy sự kết thúc thời kỳ ảm đạm của kim loại quý bao gồm việc kim loại không mấy tương quan với đồng euro, giá vàng tăng tại thị trường Châu Á và dòng tiền chảy vào các quỹ đầu tư vàng cũng tăng, “bất chấp việc thị trường vàng đi xuống trong thời gian gần đây, chúng tôi vẫn cho rằng triển vọng giá vàng dài hạn sẽ đi lên”.
Bên cạnh đó, một số nhà quan sát thị trường cũng cho rằng nếu giá vàng được giao dịch quanh ngưỡng 1.580 USD/oz, thị trường kim loại quý sẽ có thể bật lại trong tuần này và thử nghiệm ở ngưỡng 1.600 USD/oz.
Tuy nhiên, cũng có một số dự đoán không mấy lạc quan đối với kim loại quý. Daniel Pavilonis, nhân viên môi giới cao cấp của RJO Futures cho biết, trong thời gian tới vàng sẽ tiếp tục giảm giá, “với thông tin gần đây từ J.P.Morgan, tôi cho rằng diễn biến các nhà băng sẽ còn tiếp tục xấu đi. Do đó, đồng đô la sẽ mạnh lên và ít khả năng có gói định lượng thứ 3”.
ATC
Thành Viên Có Cống Hiến GOLD24K.INFO
Giá USD tự do lên 21.000 đồng/USD Thứ hai, 14/05/2012 07:34
Sau nhiều ngày trụ ở mức thấp, giá USD tự do bất ngờ tăng trở lại, chỉ trong ngày 12 và 13/5 giá USD tự do đã tăng khoảng 150 đồng. Theo Tuổi trẻ, cuối ngày 13/5, giá USD bán ra trên thị trường tự do đạt 21.000 đồng.
Các chủ tiệm vàng cho biết giá USD tăng do thị trường bất ngờ hút hàng trong khi nguồn cung hạn chế do cuối tuần các ngân hàng không làm việc.
Hiện tỷ giá bình quân liên ngân hàng vẫn được Ngân hàng Nhà nước giữ ở 20.828 đồng/USD, không đổi kể từ 24/12/2011.
Tại các ngân hàng, cuối tuần qua, giá USD mua vào ở mức 20.810 - 20.820 đồng, bán ra khoảng 20.870 đồng.